- Doppler Measurements
- Pulse Volume Recording (PVR)
- Photoplethysmography (PPG)
- Air Plethysmography (APG)
- Segmental Blood Pressure
Doppler Measurements
Doppler measurements of the peripheral arteries, particularly those in the legs, are an important qualitative diagnostic method to determine the arterial vascular elasticity, as part of a complete Peripheral Arterial Disease (PAD) diagnosis.
The primary assessment includes the determination of the number of “phases” in a Doppler waveform over one cardiac cycle, typically between one (abnormal) and 3 (good elastic vessel).
In the lower extremities, the arteries that are typically measured with Doppler include the Dorsalis Pedis, Posterior Tibial, Popliteal, and Femoral arteries. In the upper extremities, the most commonly measured arteries include the Radial, Ulnar and Brachial vessels.
Which Doppler Probe should be Used?
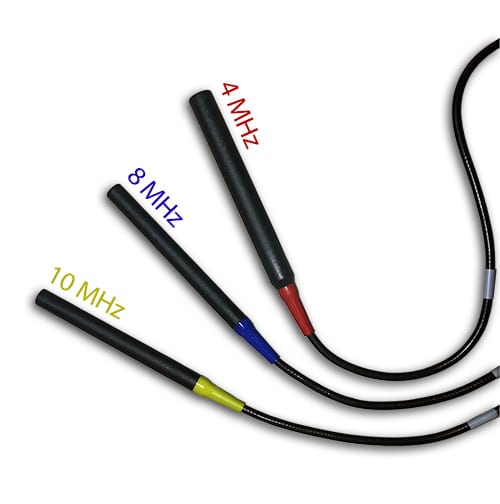
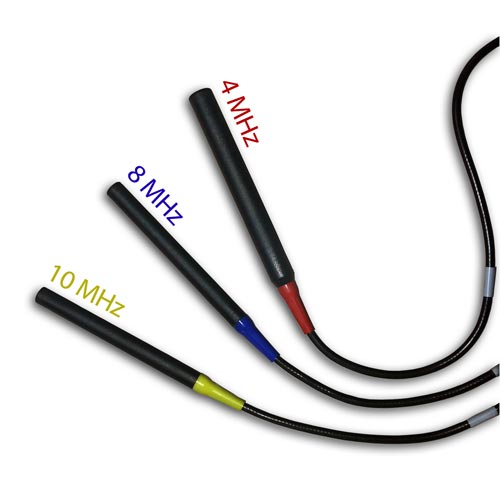
The requirements from the Doppler probe is to have an appropriate frequency that meets the measurement requirements. Thus, for the Doppler measurement of the smaller, more superficial vessels such as the DP or PT, a 10 MHz or 8 MHz probe is used, while for larger or deeper vessels, the 4 MHz probe is preferred.
Also, the requirement from the Doppler is to have Continuous Wave (CW) Doppler, direction sensitivity and bi-directional flow capabilities, audible output, and recording. Above all, a complete color spectral analysis is a preferred option as it allows us to distinguish between forward and reverse blood flow clearly.
Using the Falcon for Doppler Measurements
The Falcon provides a wide range of CW Doppler probes that cover the complete range of measurements in peripheral arteries. These probes include the standard 4 MHz and 8 MHz probe frequencies, as well as a 10 MHz probe for very shallow and small vessels. Unlike many other systems in the market, the Falcon provides complete spectral analysis in full color, which allows to clearly distinguish between forward and reverse flows. This helps prevent the inaccuracies of displaying only an envelope which could be mistaken as just noise, or vice versa.
All Doppler settings can be pre-configured in the protocol, so in order to complete the test only a single button can be used. The user can modify the preferred sweep time display, scale, gain, filter or sound volume. Many other Falcon features and options are designed to simplify the use of the Falcon Doppler physiologic measurements followed by a complete clinical diagnosis, in a fast and efficient way.
While the diagnosis of the Doppler measurements is primarily qualitative, the Falcon also provides a range of quantitative parameters, including the Peak, Mean and Diastolic velocities, the PI, RI and S/D pulsatility indices, and the rise time and heart rate. These parameters allow for improved quantification and diagnosis of a primarily qualitative test.
Doppler Probes
Gold Standard ABI Measurement Method
Expected Results
The diagnosis of the peripheral Doppler waveforms is primarily qualitative in nature. The focus is on determining the number of “phases” in the Doppler signal. If the waveform has a dominant forward flow, followed by a smaller reverse flow section and then another small forward flow, this waveform is considered to have 3 phases or a tri-phasic waveform. Likewise, if the final small forward flow is not seen, then the signal is considered bi-phasic, and if only the initial forward flow is seen, then the signal is considered mono-phasic.
Typically, a “normal” peripheral Doppler waveform is a tri-phasic waveform, indicative of good and elastic arteries. With the progression of arterial disease, the vessels become stiffer, and the third and then the second flow phases start to disappear. With a monophasic Doppler waveform, the systolic peak is also less sharp and becomes wider and rounded.
Example of a CW Doppler waveform measured using Viasonix Falcon/PRO.
Selected Literature
Overview of Peripheral Arterial Disease of the Lower Extremity, Ali F. AbuRahma and John E. Campbell, Noninvasive Vascular Diagnosis, A.F. AbuRahma (ed.), Springer International Publishing AG 2017, Ch 21, pp 291-318
Lower Extremity PAD, Hirsch et al. 2005, ACC/AHA 2005 Guidelines for the Management of Patients With Peripheral Arterial Disease
Characterizing Triphasic Biphasic, and, Monophasic Doppler Waveforms: Should a Simple Task Be So Difficult?, Robert Scissons, JDMS 24:269–276 September/October 2008
2016 AHA/ACC Guideline on the Management of Patients With Lower Extremity Peripheral Artery Disease; A Report of the American College of Cardiology/American Heart Association Task Force on Clinical Practice Guidelines; Journal of the American College of Cardiology, Vol. 69, No. 11, 2017
Lower Extremity Arterial Physiologic Evaluations, Vascular Technology Professional Performance Guidelines, the Society for Vascular Ultrasound, 2019
Noninvasive Physiologic Vascular Studies: A Guide to Diagnosing Peripheral Arterial Disease, Robert Sibley et al, radiographics.rsna.org, Volume 37 Number 1, p 346-357.
Segmental Blood Pressure
Lower extremity Segmental Blood Pressures (SBP) diagnosis refers to the measurement of the systolic blood pressure at various sites along each leg.
Segmental blood pressures is a physiologic test, which is performed using a physiologic machine in order to help in localizing arterial obstruction to flow along the limb, as well as the physiological severity of the obstruction. This is in contrast to ultrasound imaging of the lower limb, which is focused on detecting and quantifying the anatomical severity of the arterial obstruction to flow.
Physiologic and anatomical two types of tests complement each other. They are frequently performed one after the other to diagnose both the physiological and the anatomical severity of the pathology for optimal clinical diagnosis.
Segmental Blood Pressures typically include the following lower extremity sites:
- Thigh
- Above knee
- Below knee
- Ankle
- Sometimes calf, metatarsals, and toes are also included.
How to Measure Segmental Blood Pressures
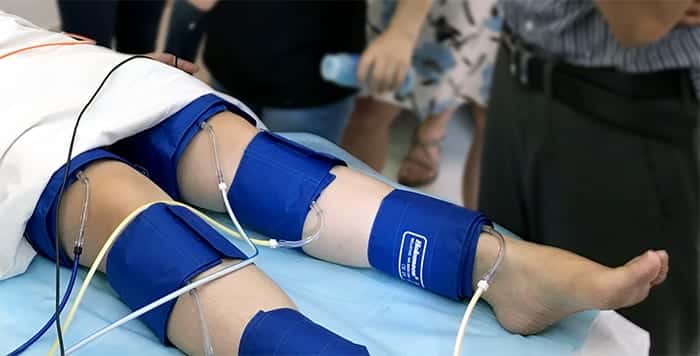
A segmental pressures machine is required for this test. Performing the lower limb segmental blood pressure test is fast and simple. It requires placing dedicated pressure cuffs on each target site along each leg and then inflating each cuff separately while measuring the downstream Doppler or PPG waveform. Most importantly, Doppler is superior and is widely considered the gold standard method.
Doppler is typically measured at the level of the Posterior Tibial (PT) or Dorsalis Pedis (DP) arteries, while PPG is measured on the toes. When the cuff inflation pressure exceeds the arterial systolic pressure, the cuff pressure is gradually bled until the distal Doppler or PPG waveforms re-appear. The pressure of the initial re-appearance is considered the systolic pressure.
The measurement process typically starts at the ankle level and then moves up along the leg to minimize the occlusion effect on the complete limb.
Using the Falcon for SBP Test
The Falcon segmental pressures machine is designed for straight-forward segmental blood pressure measurements. Specifically, the Falcon/Pro is the ideal model to use, as it has 10 separate color-coded pressure channels allowing quick and effective diagnosis. First, the pressure cuffs are wrapped around each target site along both the right and left legs. Then, a lower extremity protocol needs to be selected. At this point, the test is ready to start and can be completed in a matter of just a few minutes.
To complete the test, a single button can be used. However, the user has the option to determine the preferred target inflation pressure, deflation rate, sweep time display, gain, filter, display scale, and more. A wide range of Doppler probes of various frequencies (4MHz, 8MHz, 10 MHz) is available for optimal measurements according to the target vessel, as well as a wide range of color-coded PPG sensors (Disk, toe clips, finger clips) for ease of use.
Additionally, many other Falcon features and options, such as automatic cuff inflation as soon as a signal is identified, simultaneous measurements, display of contralateral results, and many more options are all designed to simplify the use of the Falcon physiologic system in a fast and efficient way.
In conclusion, the Falcon allows completing the test rapidly. Once the PT or DP Doppler waveforms are obtained, all that is needed is to sequentially inflate and then deflate each ipsilateral pressure cuff along the leg until the Doppler waveform re-appears, freeze the measurement and start the process with the next pressure cuff up the leg. Finally, an automatic cursor is placed at the proposed systolic pressure location, and the user can manually adjust the location for improved results. It is important to note that the pressure index is automatically displayed for each site, calculated as the site systolic pressure divided by the higher systolic pressure of the right/left brachial.

Doppler Probes
Gold Standard ABI Measurement Method
PPG Sensors
Secondary Method of ABI Assessment
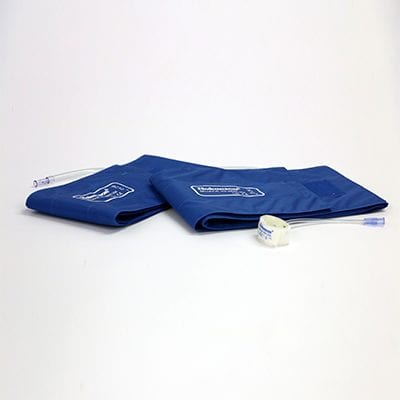
Inflatable Cuffs
High quality available in a variety of sizes
Expected Results of Segmental Blood Pressures
When measuring segmental blood pressures, the focus is on the pressure difference between each 2 consecutive adjacent sites, as well as the pressure difference between similar sites on the right and left legs.
A relatively large pressure difference (or pressure drop) suggests the location of the pathology. For example, a large pressure drop between the thigh and the adjacent above knee site suggests an arterial obstruction to flow, which is located between the thigh and the knee.
The magnitude of the pressure drop threshold that marks a pathological condition may vary from one institute to another. Still, a common thumb rule is a pressure difference which is typically larger than 20 mmHg.
An example of a SBP measurement taken from Viasonix Falcon/PRO physiologic machine using 8 MHz CW Doppler probe.
Selected Literature
Overview of Peripheral Arterial Disease of the Lower Extremity, Ali F. AbuRahma and John E. Campbell, Noninvasive Vascular Diagnosis, A.F. AbuRahma (ed.), Springer International Publishing AG 2017, Ch 21, pp 291-318
Peripheral vascular disease assessment in the lower limb: a review of current and emerging non‑invasive diagnostic methods, Shabani Varaki et al, BioMed Eng OnLine (2018) 17:61
2016 AHA/ACC Guideline on the Management of Patients With Lower Extremity Peripheral Artery Disease; A Report of the American College of Cardiology/American Heart Association Task Force on Clinical Practice Guidelines; Journal of the American College of Cardiology, Vol. 69, No. 11, 2017
Lower Extremity Arterial Physiologic Evaluations, Vascular Technology Professional Performance Guidelines, the Society for Vascular Ultrasound, 2019
What is Air Plethysmography?
The Air Plethysmography (APG) test relates to the use of a pressure cuff as a sensor. The pressure cuff is inflated to low pressure, such as around 20 mmHg for lymphatic occlusion or around 60 mmHg for venous occlusion, and then changes in air displacement within the cuff are used to measure blood volume changes at the measuring site.
Most clinical uses of APG are for diagnosis of venous disease and global lower limb hemodynamics, including chronic venous obstruction to flow, venous reflux, calf muscle pump action, or venous hypertension.
Performing Air Plethysmography Test
The APG test allows the selection of patients who may benefit from certain surgical interventions or consider noninvasive therapeutic measures such as limb compression.
The changes in the circumference of the encircling pressure cuff result in pressure changes that correlate with volume displacement. Thus, the resulting average cuff pressure serves as the sensing element for venous hemodynamics.
The use of APG is not as popular as using PPG sensors due to the simplicity and ease of use of PPG, yet it is still considered in many places as the gold standard primarily for venous testing. APG is also used in conditions where PPG is not considered reliable enough.

Inflatable Cuffs
High quality available in a variety of sizes
Using the Falcon for APG Test
The Falcon has a dedicated Air Plethysmograph protocol, allowing a fast and simple diagnosis. All that is required is to wrap the pressure cuffs around the site of interest, select the APG protocol in the software, and press the inflate button. The pressure cuffs are inflated to the pre-configured pressure, which can be selected from low lymphatic occlusion pressures such as 20mmHg, or venous occlusion pressures in the range of 60 mmHg. The Falcon allows the APG test to be performed bilaterally on the right and left lower or upper limbs. Furthermore, the Falcon allows the APG test to be performed simultaneously on up to 10 different sites, such as all digits or toes or various sites along with the lower/upper limbs.
The Falcon Sweep time and Scale options allow zooming in or out on the waveforms along the X-axis and the Y-axis, respectively. Displaying the waveforms with a time scale of several minutes allows to clearly identify trend changes in the APG signal.
Expected Results
The APG test provides primarily qualitative information. Quantification of the APG for hemodynamic assessment depends on the specific procedure that is performed. In particular, APG is used to assess the response to alterations in patient posture and muscular exercise.
Selected Literature
Peripheral vascular disease assessment in the lower limb: a review of current and emerging non‑invasive diagnostic methods; Shabani Varaki et al, BioMed Eng OnLine (2018) 17:61
Ultrasound Diagnosis of venous Insufficiency, Marsha M. Neumyer, in “Introduction to Vascular Ultrasonography”, Ed. Pellerito and Polak, Elsevier Health Sciences, 2012, Ch 24, pp 408-428
Overview of Peripheral Arterial Disease of the Lower Extremity, Ali F. AbuRahma and John E. Campbell, Noninvasive Vascular Diagnosis, A.F. AbuRahma (ed.), Springer International Publishing AG 2017, Ch 21, pp 291-318
Pulse Volume Recording (PVR)
Pulse Volume Recording (PVR) is a pneumo-plethysmography test that is widely used for non-invasive diagnosis of lower extremity peripheral arterial disease (PAD).
Pulse Volume Recording is an air plethysmography waveform analysis test used to detect the segmental volume changes in the limb resulting from the flowing blood as a function of the cardiac cycle. This test is usually performed with a PVR machine.
How to Perform PVR Measurements
Equipment specifically capable of pulse volume recording is required for this test. With pulse volume recording, similar to the Segmental Blood Pressure (SBP) measurements, dedicated pressure cuffs are wrapped around the target limb segments prior to initiating the test. These sites typically include the thigh, above the knee, below the knee, and ankle on each leg. The cuffs are then inflated using a PVR machine to a pressure that would occlude the venous return yet will still maintain the arterial flow un-obstructed. This target pressure is typically 65 mmHg and is kept constant throughout the PVR measurement.
Once the cuff pressure is stabilized, the Pulse Volume Recording waveform is generated based on the pressure changes in the air inside the pressure cuff as the result of minute limb circumference changes. Thus, the elasticity or stiffness of the arterial circulation in the legs will determine, in part, the shape of the PVR waves. This test is mostly qualitative in nature, and the focus is on the shape of the obtained PVR waveforms.

Inflatable Cuffs
High quality available in a variety of sizes
Using the Falcon for PVR measurements
As a PVR machine, the Falcon allows immediate Pulse Volume Recording testing that can be completed very rapidly for each measured site. PVR measurements with the Falcon vascular diagnostic system can be performed either sequentially for one site after the other, bilaterally for simultaneous PVR measurements on similar right/left leg sites, or simultaneously on as many as 10 sites in parallel. The user is only required to place the color-coded pressure cuffs around each target site on both legs. Then, one of the PVR protocols needs to be selected. Now the test is ready to start and can be completed in just a couple of minutes.
All PVR settings can be pre-configured in the protocol, so only a single button can be used to complete the test. The user can modify the preferred target inflation pressure, sweep time display, scale, or filter.
Many other Falcon features and options, such as automatic simultaneous measurements or display of contralateral results, are designed to simplify the use of the Falcon PVR physiologic system followed by a complete clinical diagnosis in a fast and efficient way.
While the diagnosis of Pulse Volume Recording is primarily qualitative, the Falcon also provides a range of quantitative parameters, including the waveform amplitude, rise time, or heart rate. Additional calculations such as the RAR(Relative Amplitude Reduction) or waveform slope are also available.
Expected Results of Pulse Volume Recording Test
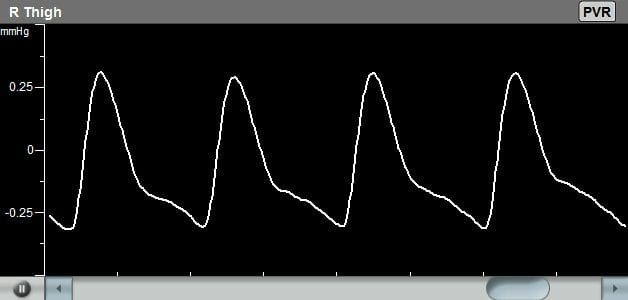
The diagnosis of the Pulse Volume Recording waveforms is mostly qualitative in nature. Clinicians are normally interested in the qualitative shape of the PVR waveform, specifically the systolic rise curve, the peak amplitude shape, the dicrotic notch during the downward section, and the diastolic section of the waveform. Typically, a “normal” PVR waveform consists of a rapid systolic upstroke, a relatively sharp peak, a downstroke with a prominent dicrotic notch, and clear diastole.
With increasing arterial disease, the PVR waveform becomes attenuated, the upstrokes and downstrokes are less prominent, the peak of the pulse volume waveform becomes rounded, the dicrotic notch in the waveform starts to disappear, and the waveform amplitude decreases and ultimately becomes flat. Additional quantitative parameters such as the absolute PVR amplitude or the relative amplitude reduction (RAR) and slope are discussed in the literature as possible additional quantitative diagnostic measures.
Example of a Pulse Volume Recording waveform measured using Viasonix Falcon/PRO PVR machine
Photoplethysmography (PPG)
Photo-plethysmography (PPG) sensors are vital in every physiological vascular testing examination.
The PPG sensors transmit infra-red waveforms to the skin and detect the signals that are reflected back to the sensor from the skin. The skin partially absorbs the transmitted signals, and the reflected signals are a function of this light absorption, which in turn is a function of the local blood perfusion. Therefore, the PPG waveforms reflect local and relatively shallow skin variations in blood flow.
The Photo-plethysmograph detected local blood volume changes generate a pulsatile waveform, which is very similar to the Pulse Volume Recording (PVR) waveforms. However, PPG is based on optical technology, while PVR technology is based on a pressure-sensor measurement.
How to Perform PPG Measurement
Examiners usually use PPG measurements as support adjunct measurements as part of other physiological tests such as TBI(Toe Brachial Index) examinations, Venous Reflux test, TOS(Thoracic Outlet Syndrome) evaluation, Palmar Arch test, Raynaud’s examinations, and more.
Since the emitted infra-red light’s penetration is shallow, PPG sensors are mostly used in peripheral sites, such as the toes and digits. The sensors may have different mechanical configurations that physically match a specific body site to simplify attachment.
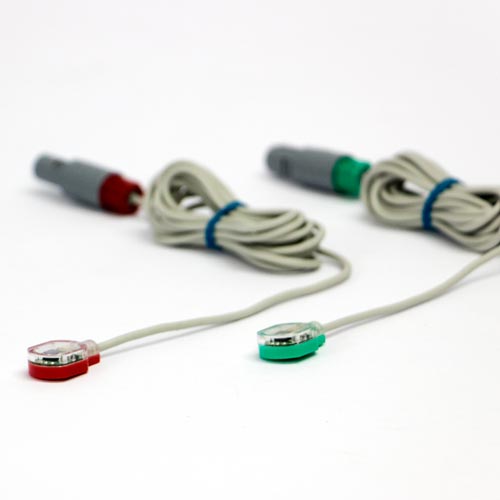
PPG Disc
For venous reflux and TBI
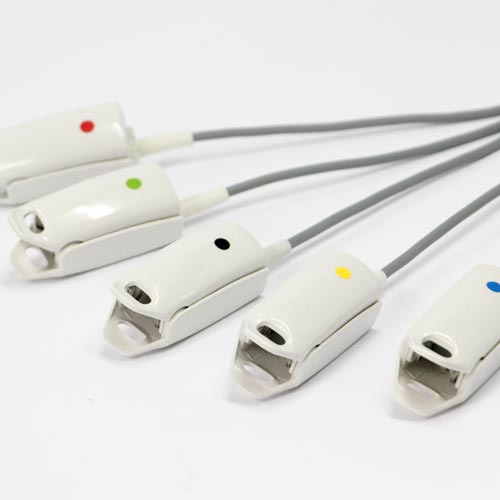
PPG Finger Clips
Ideal for Raynaud’s Syndrome
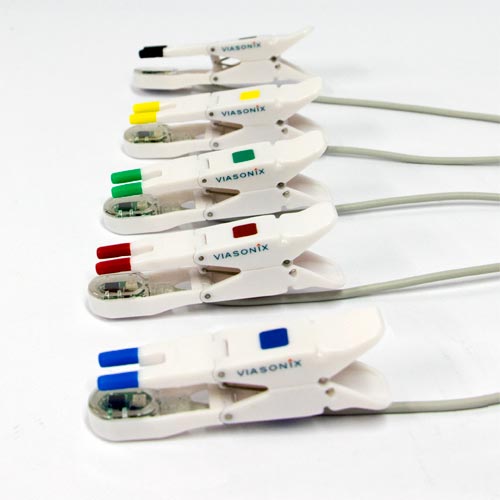
PPG Toe Clips
Variety of uses including ABI & TBI
Using the Falcon for PPG Readings
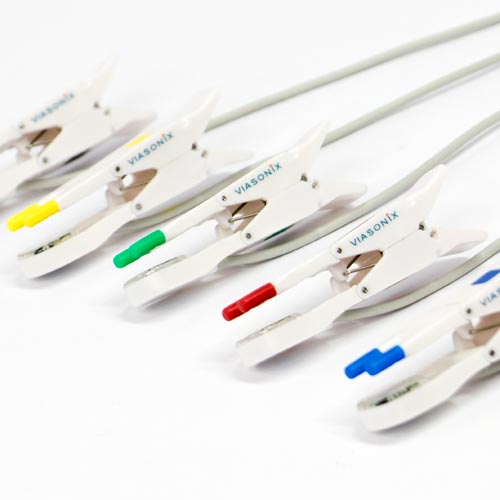
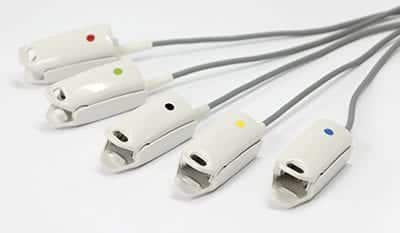
The Falcon/Pro supports 5 independent and color-coded PPG ports, and the Falcon/Quad and Falcon/ABI+ models support 4 independent and color-coded PPG ports. The Falcon has several PPG sensor configurations that are designed to meet the various potential measurement sites. These configurations include:
- Toe Clip PPG sensor design, which is optimal for PPG measurements on the toes.
- Finger Clip design, which is ideal for measurements on the digits (fingers).
- Disk PPG sensor design, which is attached to the skin with a special dedicated PPG adhesive sticker. It is practical for measurements on the calf or the tip of the toes, or other similar peripheral sites.
These different designs support the various physiological testing protocols that are supported by the Falcon. The Finger Clip or Toe Clip sensors allow simultaneous measurements on all 5 fingers or toes for quick Raynaud’s assessment, Thoracic Outlet Syndrome (TOS) diagnosis, Palmar Arch testing, and of course also TBI (Toe Brachial Index) or similar studies. The Disk sensor is advantageous in Venous Reflux testing or TBI measurements, particularly on fat or short toes.
The Falcon photoplethysmography system allows complete control over the display sweep time of the waveforms from just 1 second and up to several minutes, control of the amplitude display scale, signal filtering, and sensor port selection. These unique features allow complete configuration per examiner needs.
In addition, for each phasic waveform, the PPG amplitude and systolic rise time are presented, as well as the current heart rate (HR). Dedicated summary screens with schematic pictures allow complete and simple test assessments for clear and optimal diagnosis and are also included in the test reports.
Expected Results
PPG measurements are widely used in various physiological test protocols, and in most cases, the main objective is to qualitatively diagnose changes in waveform quality or amplitude under specific conditions. For example, a sharp decrease in waveform amplitude during a TOS test when testing a particular position, a flattening of the PPG curve during vessel compression as part of the Palmar Arch test, or a very long recovery time after ice water immersion during a Raynaud’s Syndrome examination.
In addition, PPG waveforms help to determine systolic blood pressure during TBI or ABI diagnosis. A proximal pressure cuff is inflated until the distal PPG waveform flattens with total occlusion. Then, during the cuff deflation process, the pressure at which the PPG waveform reappears for the first time is considered as the systolic blood pressure at the measurement site.
An example of a photoplethysmography measurement taken from Viasonix Falcon/PRO system.
Selected Literature
Overview of Peripheral Arterial Disease of the Lower Extremity, Ali F. AbuRahma and John E. Campbell, Noninvasive Vascular Diagnosis, A.F. AbuRahma (ed.), Springer International Publishing AG 2017, Ch 21, pp 291-318
Comparison of two methods based on photoplethysmography for the diagnosis of peripheral arterial disease, Christian Høyer et al., Scandinavian Journal of Clinical and Laboratory Investigation, 2017
The effect of percutaneous transluminal angioplasty of superficial femoral
artery on pulse wave features, Mikko Peltokangas et al., Computers in Biology and Medicine 96 (2018) 274–282
Nonimaging Physiologic Tests for Assessment of Lower Extremity Arterial Disease, Marsha M. Neumyer, in “Introduction to Vascular Ultrasonography”, Ed. Pellerito and Polak, Elsevier Health Sciences, 2012, Ch 14, pp 244-261
Peripheral vascular disease assessment in the lower limb: a review of current and emerging non‑invasive diagnostic methods; Shabani Varaki et al, BioMed Eng OnLine (2018) 17:61
Photoplethysmographic Venous Refilling Times Following Ultrasound Guided Foam Sclerotherapy for Symptomatic Superficial Venous Reflux: Relationship with Clinical Outcomes, Darvall et al., Eur J Vasc Endovasc Surg (2010) 40, 267e272


